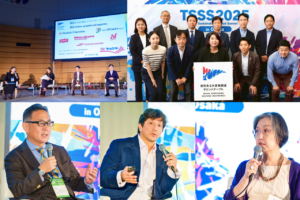
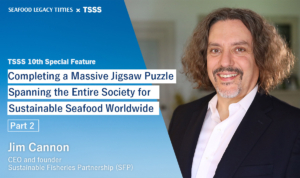
Let's consume more domestically produced, sustainable seafood! A Mexican-based, industry-led NGO is working hard to achieve this (Part 2)
Interview


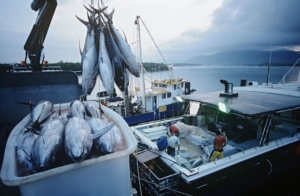
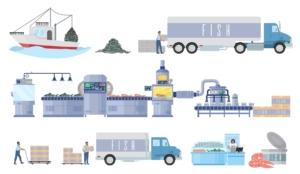
The ocean is the planet’s largest life‑support system, regulating climate, supporting global transport and trade, and providing food and livelihoods for billions. Yet marine and coastal ecosystems face growing pressure as industrial activity expands rapidly. Although some companies are reducing their impact, many remain unaware of their dependence on, and responsibility to ocean health, creating an imbalance between fast industrialisation and slower protection efforts. Securing a sustainable ocean future requires coordinated action across ocean‑based sectors—such as shipping, seafood, energy, and ports—and land‑based industries that affect marine environments through pollution and resource use. Long‑term economic success depends on a healthy, resilient ocean.
Insights from the World Benchmarking Alliance’s (WBA) Nature Benchmark in 2022 and 2023 revealed an important trend: companies were acting far less on marine biodiversity compared to terrestrial and freshwater ecosystems. In other words, the ocean was being left behind.
To close this gap, WBA created the Ocean Benchmark—a tool designed to strengthen corporate accountability and better define what responsible business behaviour looks like in relation to the ocean.
The Ocean Benchmark aims to:
・Encourage companies to measure and disclose their marine impacts and dependencies more effectively.
・Accelerate progress toward a nature-positive future by assessing how companies reduce harm to marine ecosystems.
・Embed ocean considerations into global business norms and policy agendas, helping ensure that oceans are not overlooked in sustainability discussions.
The benchmark evaluates 125 companies across industries that either directly operate in the ocean or significantly affect marine ecosystems through their activities. These companies were selected from WBA’s broader SDG2000 list—the 2,000 most influential firms globally—based on criteria highlighting companies with major environmental, social, or economic impact.
Industry selection was guided by research identifying the largest ocean-related corporations (those generating around 60% of total ocean-economy revenue) as well as major land-based sectors exerting pressure on marine environments.
The industries assessed include:
・Ocean-based sectors: Shipping (21 companies), Seafood (21), Marine equipment (10), Port operations (10), Offshore wind (7), Shipbuilding & repair (6), Cruise lines (5)
・Land-based sectors with major marine impacts: Agriculture products (5), Apparel & footwear (5), Chemicals (5), Construction materials (5), Containers & packaging (5), Food production (5), Food retail (5), Personal & household products (5), Pharmaceuticals & biotechnology (5)
Among these are four Japanese seafood companies: Nissui, Maruha Nichiro, OUG Holdings, and Kyokuyo.
The full methodology—available on WBA’s website—includes 47 indicators grouped into four key areas:
1.Governance: How companies integrate ocean protection into decision-making, strategy, and oversight.
2.Ecosystems & Biodiversity: Actions taken to prevent harm, restore habitats, manage resources responsibly, and protect marine species.
3.Social Responsibility: Consideration for workers, fishers, and coastal communities affected by ocean-related operations.
4.Core Social Indicators: Company performance on issues such as human rights, labour conditions, and ethical conduct.
This framework builds on WBA’s long-standing benchmarking experience—including the Seafood Stewardship Index—and incorporates feedback from scientists, civil society, indigenous and ocean communities, and industry representatives.
The first results of the Ocean Benchmark show a clear message: most companies have a way to go to protect marine ecosystems. Across all 125 companies assessed, the average score is only 20.3 out of 100.
Top performers
Across ocean-related sectors, the top performers are:
1.Mowi
2.Ørsted
3.Vattenfall
4.Nueva Pescanova
5.A.P. Moller – Maersk
For seafood companies, the leaders are:
1.Mowi
2.Nueva Pescanova
3.Nissui
4.FCF
5.Thai Union
Performance varies by region:
・Europe leads with an average of 23/100
・East Asia & Pacific follows at 18/100
・North America trails with 11/100
Across all companies, scores were generally highest in Governance, followed by Social Responsibility, and lowest in Ecosystem & Biodiversity—highlighting that addressing impacts on marine ecosystems remains a challenge.
Overall performance
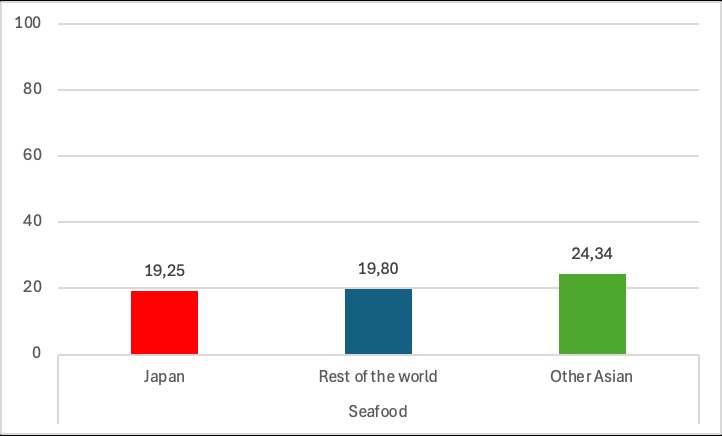
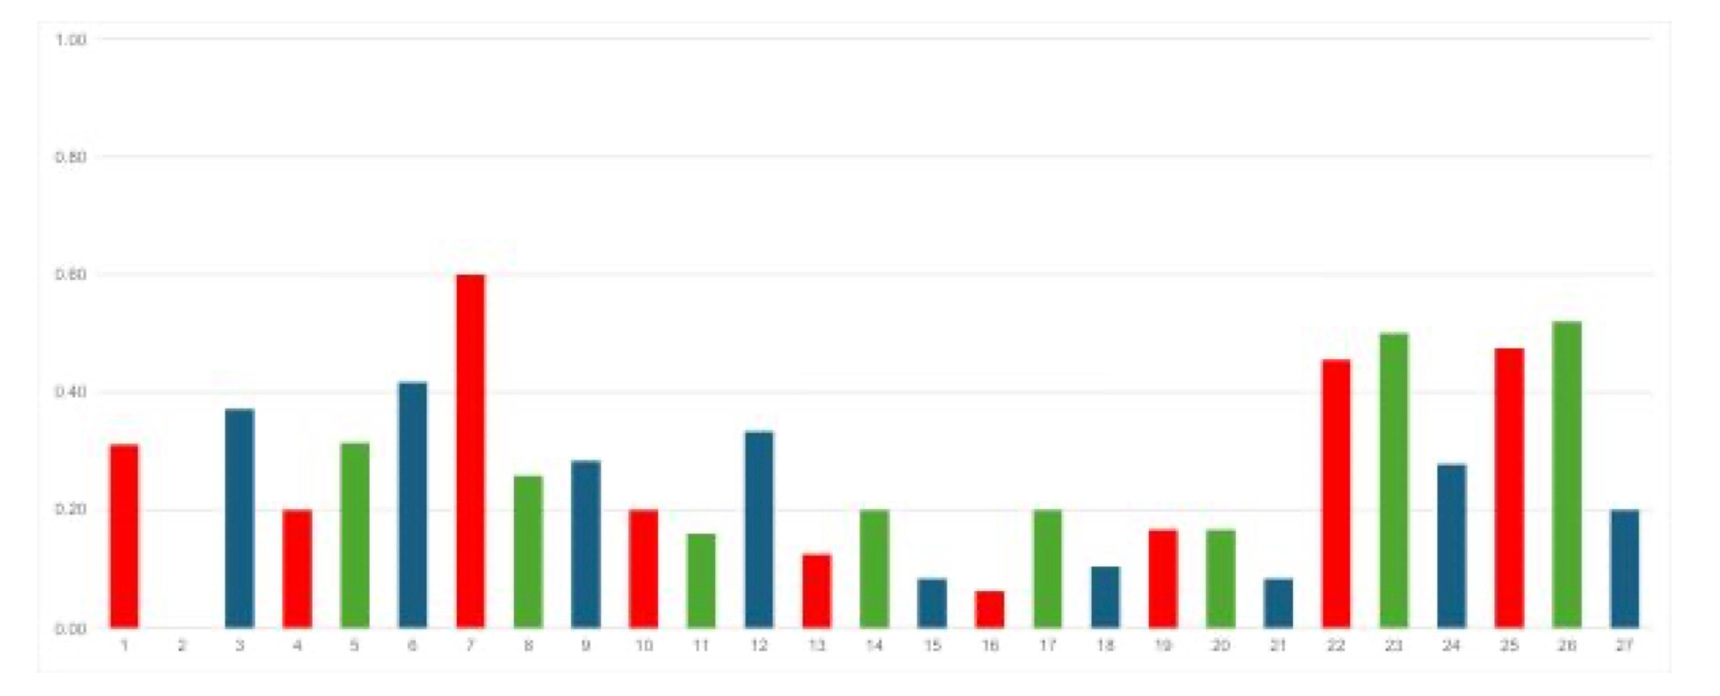
Japanese seafood companies scored similarly to companies outside Asia and slightly below other Asian seafood companies (Figure 1)
Among Japanese seafood companies, Nissui stands out as the best performer. It ranks 11th out of 125 companies, with a score of 37/100. Nissui performs particularly well in governance and core social indicators, but—like the other Japanese seafood companies—scores lower on biodiversity and social responsibility. This overall pattern is consistent across Japanese seafood companies (Figure 2).
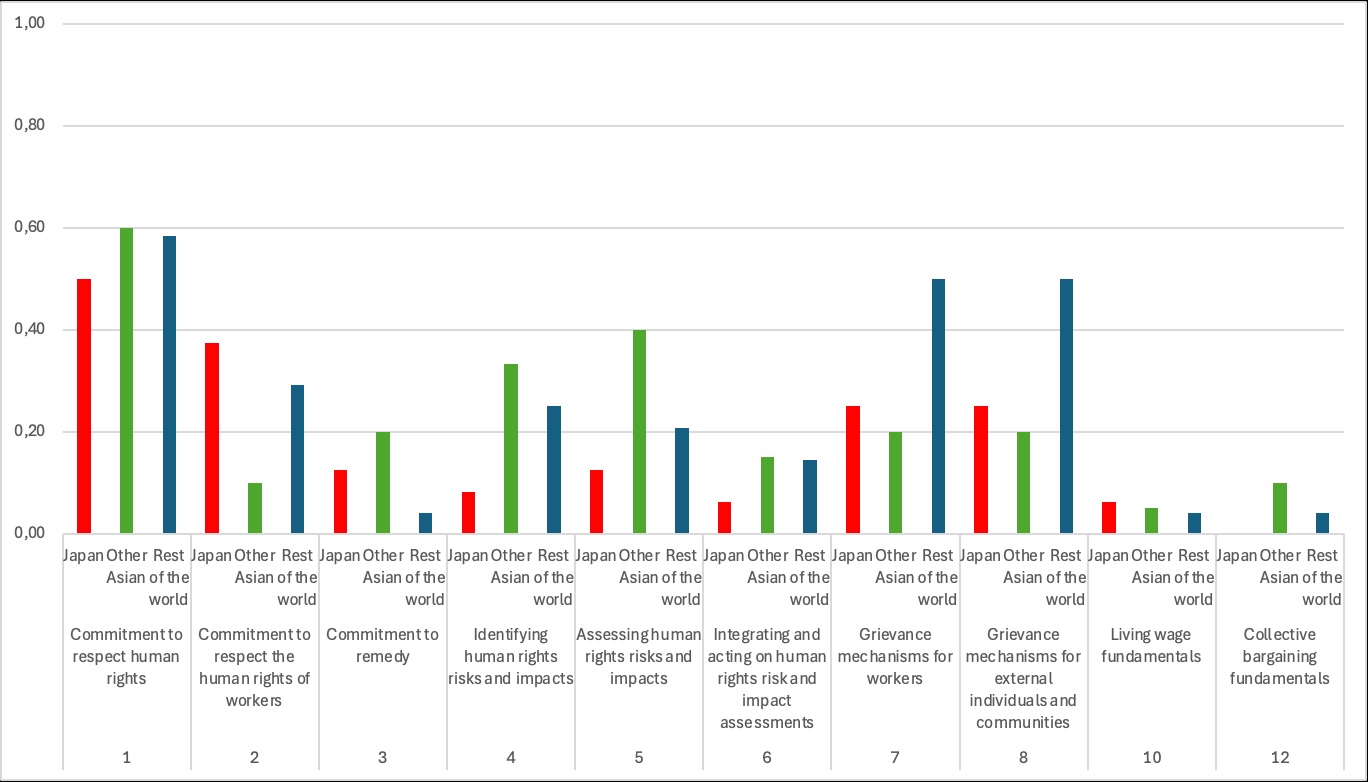
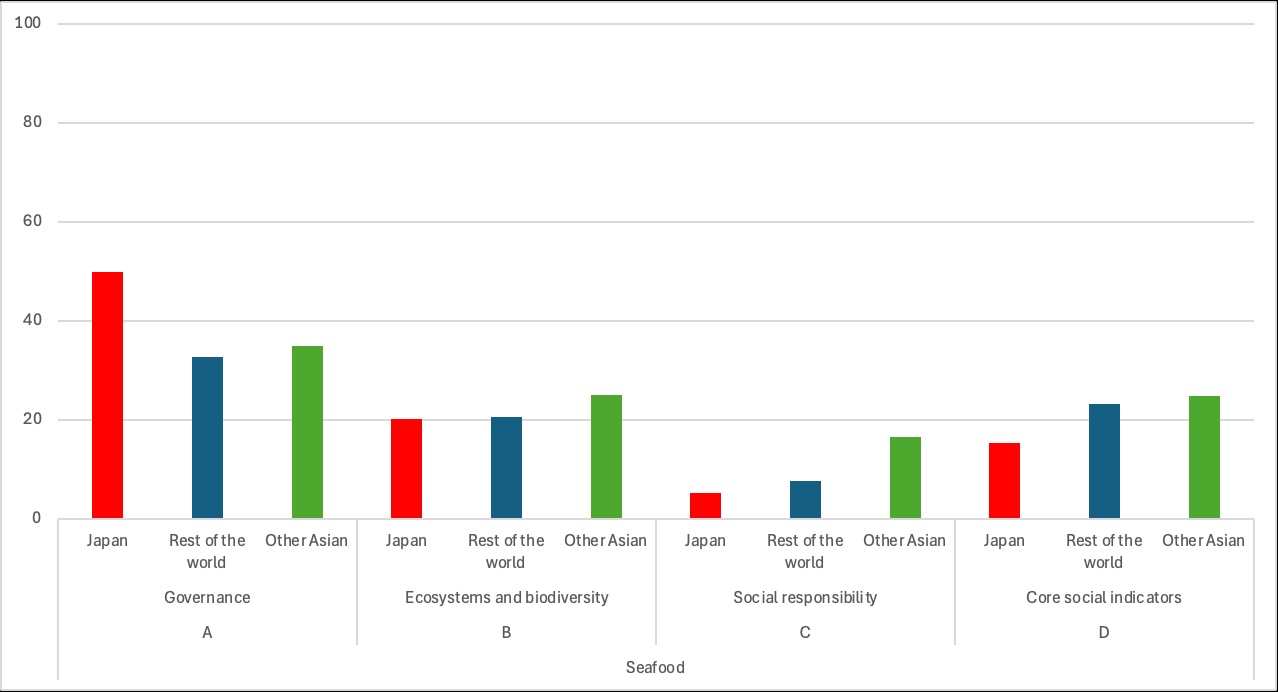 Figure 2. Average measurement area performance of Japanese vs. other Asian vs. rest of the world seafood companies.
Japanese companies score as well or better than other Asian and non-Asian seafood companies on governance (Figure 3). They perform especially strongly on the indicator “Sustainability targets and plans,” which assesses whether companies set measurable sustainability goals across their operations and supply chains. This suggests that Japanese firms are good at establishing formal commitments and long-term plans.

Performance in this area is mixed (Figure 4a and b).
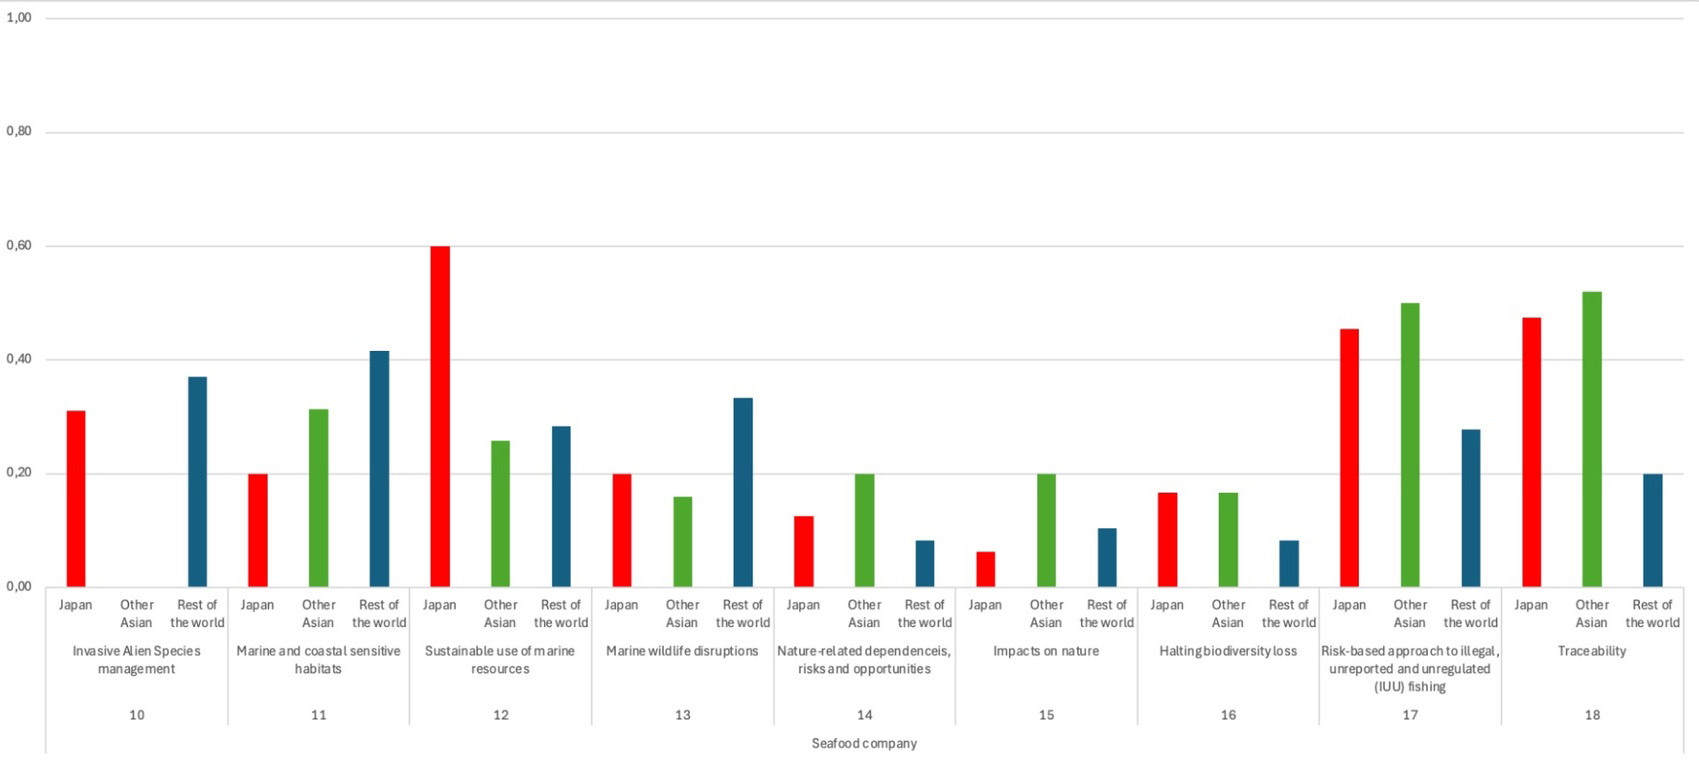
・Ghost gear management: The company prevents and reduces its abandoned, lost or otherwise discarded material (ALDM).
・Sustainable use of marine resources: The company demonstrates sustainable management of marine resources.
・Illegal, Unreported and Unregulated (IUU) fishing: The company uses a risk-based approach to assess and mitigate illegal, unreported and unregulated (IUU) fishing issues across its operations and supply chain.
・Traceability systems: The company demonstrates a commitment to implementing, monitoring and reporting traceable products and materials across its operations and supply chain.
Nissui and Umios stand out here:
Nissui: strong on sustainable resource use.
Umios: strong on IUU fishing and marine habitat protection.
・Protection of marine and coastal habitats: The company avoids or reduces the impacts of its direct operations on marine and coastal sensitive habitats.
・Greenhouse gas emissions: The company reduces its scope 1, 2 and 3 greenhouse gas (GHG) emissions in line with a 1.5°C pathway.
These are global challenges for many seafood companies, but are particularly notable in the Japanese group.
In the area of social responsibility, Japanese seafood companies generally score lower than both other Asian companies and those from the rest of the world (Figure 5).
The one exception is the indicator “Commitment to respect the human rights of workers,” where several Japanese companies perform relatively well.
・Nissui scores strongly on human rights commitments, worker rights, and grievance mechanisms.
・Umios also performs well on the core human rights commitment.
However, broader social responsibility issues—such as community rights, fair working conditions across the supply chain, and social due diligence—remain areas for improvement.
WBA’s 2026 Ocean Benchmark shows that while Japanese seafood companies—especially Nissui—are relatively strong in governance and setting sustainability targets, overall corporate action to protect the ocean remains limited. Across the benchmark, scores are low, and Japanese companies in particular lag on marine and coastal habitat protection, greenhouse gas reduction, and broader social responsibility, despite good performance on traceability and IUU fishing. The message is clear: Japan’s seafood sector has solid foundations, but turning commitments into stronger action on biodiversity, climate, and people is now essential for long‑term competitiveness and ocean health.
Written by: Helen Packer
Company Engagement Manager, World Benchmarking Alliance
share


Key terms and concepts to understand seafood sustainability.